Chapter 2: Getting started
2.1 Introduction
Before we delve into the details of development, the first step in the process is ensuring that we have a good local development environment. The primary programming language used in this book is JavaScript. Thankfully with JavaScript as it runs in a web browser, very few additional tools are needed, but some additional basic tools can help us.
2.2 Development environment
The area of selecting a development environment for development is a very personal one. Over time, many people find the one that works right for them. To provide a consistent experience in this book, Microsoft Visual Studio Code will be used as the primary tool for editing as it is lightweight, accessible and can be used for editing with many different languages.
Microsoft has a similar application titled Video Studio, it is important to note that we are using the Code edition and not the traditional version of Visual Studio. The free version of Visual Studio Code can be downloaded from Microsoft's website https://code.visualstudio.com/.
2.3 Client and server-side JavaScript
As many of the examples we are describing are based on JavaScript, such as the Chrome extensions, no additional server-side component is needed as they are run fully in the browser.
Where a server is required, the server-side programming language based on JavaScript, Node.js, will be used. As Node.js is quite low-level, to ensure we have many of the additional tools we often require for development, the Next.js framework is used.
Node.js can be downloaded from the official website here: https://nodejs.org/en
Next.js is based on Node.js which is the primary server-side framework described in this book. Where appropriate, a basic example of the project will be provided that we will then build on top of.
At the end of each chapter, a link to the GitHub repository is provided that correlates with each different piece of code described. Although it is possible to copy the code directly from the examples, it is suggested to download the complete example from GitHub to speed up your development and to ensure no small syntax errors cause problems.
2.4 Testing environment
As Google Chrome is currently the most widely used web browser, it will be the main web browser used during development and testing.1 Although we will be targeting Chrome, many of the examples in this book are designed to run in a cross-browser environment.
By pressing Ctrl+Shift+j the developer tool for Chrome will open. This is the primary location where we will use various commands to print the current values of variables we are working on and short messages indicating what part of the code has just run.
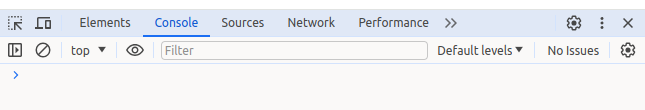
Figure 1: Chrome developer console.
When we need to review HTML elements, the shortcut Ctrl+Shift+i can be used to provide a list of the HTML elements for the current page.
2.5 Debugging Basics
When working with any programming language, the biggest issue may beginners face is the issue of tracing variables and how they change over time. In addition to this, the flow of execution can also pose several issues for beginners as with JavaScript and other programming languages, they can be run asynchronously, instead of the traditional synchronous way.
A simple way to think of this process is if we had a very simple HTML file with a piece of JavaScript. In synchronous mode, we would expect each of the lines in the file to run line by line from the very top to the very bottom of the program. Everything that is performed in the code can be easily traced as we can follow the code along until we hit a specific issue that is stopping the code from progressing.
In an asynchronous mode, the program may begin at the start and somewhere during the program, a second line of execution may be run, that is running in parallel to the current execution. This parallel execution does not have any guarantee of completing as we expect it to, and it may decide to return to us at any time with a specific response. The area of asynchronous programming causes much confusion for beginner developers but has become a core part of modern development to ensure our users have the best web experience without undue delay.
In Figure 2 we can see an example of a synchronous program as shown in (A). This program runs from Line 1 to Line 10, it is very easy to catch any errors that exist in the JavaScript if one line breaks, the next line will not run.
In (B) we can see an example of an asynchronous program. In this case, line 1 will run, and line 2 will run, but on Line 3, an asynchronous call was made to perform a task such as retrieving information from a database, or putting information in a database. The original program will continue to run, but at the same time, the background task is being performed. There is no guarantee the additional flow of execution will perform the task, or when the task will return to us in the original execution.

Figure 2: Synchronous and Asynchronous web pages.
Tracing and error messages
When writing JavaScript in a separate .js file or in a script tag as part of a HTML file, the most basic way to send information to the console is with the log() function. It can simply be called and passed any string we want to print.
console.log("hello")
In our console we will see the following output:
hello
Code timing
Sometimes we want to find out where exactly a JavaScript snippet of code is slowing us down. We can use the time() function to wrap around our code at the start and end of the code block. In the end, this function will return a time outlining how long the piece of code took to run.
In this example, block1_time is the name of the timer we have created. We need to place this label in the start and end call to the timer.
console.time("block1_time");

// Your sample code to time goes here.

console.timeEnd("block1_time");
In our console, we will see the output label followed by the number of milliseconds it took to run.
block1_time: 0.0029296875 ms
Up to 10,000 individual timers2 can be added to a page, which is more than we should need!
JSON logging
In this book, JSON is used as a standard format for moving data around between pages and retaining data structure. In the example below, we have a simple variable titled testing that contains a piece of JSON.
When we want to print this to the console, we can use the traditional log() function that will then dump the string to the console. To add a little more structure we can use the table() function that will then add field headers and row structure to the data in the console.
let testing={"first_name": "john", "second_name": "smith"};

console.log(testing);

console.table(testing);
In Figure 3 below, you can see the result of using the log() function on a JSON string.

Figure 3: console.log() result on JSON.
Figure 4 shown below shows the result of using the table() function on a JSON string. This can be very useful when working with large quantities of JSON data that may easily fill the full developer console during debugging.
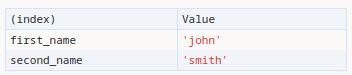
Figure 4: console.table() result on JSON.
Adding color to log() calls
Sometimes when we have large quantities of output, markers you place in the code to outline when a piece of code has run can easily become lost. To solve this problem, we can add a little bit of HTML into the log() function allowing us to style the output. In the code shown below, the %c flag is added to the start of our input, indicating that we are going to add a format to the text. We then add a comma, followed by a second string that contains the HTML we want to apply to the text. In this case, the color attribute is used to change the text color to red.
console.log("%c Great for warning messages", "color: red;")
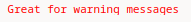
Figure 5: console.log() with some color added.
Running some checks
When writing large amounts of JavaScript we often depend on many different components working as we expect them to. A great way to ensure things are working is by using the assert() function. This allows us to pass in an expression in the form of values, if the expression returns a False then the error message associated with it will be printed to the console as an error.
In the sample code below, if 1 is not greater than 10, which it is not, then the message to the right will be printed to the console as an error.
console.assert(1>10, "One is not greater than 10");
In Figure 6 below, the resulting error message that was printed to the console can be seen. Remember, this will only be shown if the expression fails, if it is ok, no error will be shown in the console.

Figure 6: The assert() function throwing an error message.
Cleaning up
As we are sending so much data to the console, it is often the case that we need to manually clean up all the output that we have sent to the console. In this case, the clear() function can be called programmatically when needed.
console.clear()
debugger command
When working on an application, we often want to check the state of variables at a particular time. To do this we can enter the debugger command anywhere in our application and Chrome will stop the execution at that point.
debugger;
In the developer console, we will then be able to see exactly where the code stopped and the state of the variables at that time. In this code you can see the variable titled testing that was created and the JSON value associated with it.
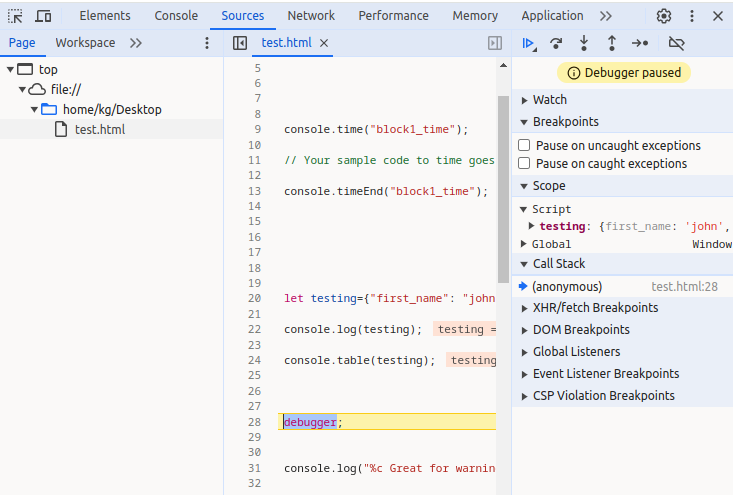
Figure 7: The debugger command halts Chrome during the page load.
In Figure 8 we can see all the debugging controls. The play button allows us to continue loading the page after we have analyzed the results. Besides this, the stepper can jump over the next function call. The up and down arrows allow you to step in and out of a function. To the right of the play button is a right-facing arrow. This enables stepping, which is the process of slowly executing each line of code one by one from where the execution stopped. F9 on the keyboard can also be used to perform this action.

Figure 8: The debugging controls.
This stepping function is the most useful to slowly explore your code and the variables at each step during the execution.
Footnotes